
A Paper by Mark Fitzsimmons
Managing Director, 360 Degrees Management Consulting
The Meeting Looked Good
Many of us have attended a meeting like this.
Sales reports a strong month. Operations says productivity has improved. Finance confirms that costs are under control. Customer service reports that most cases were closed within target.
The slides contain data, and most indicators are green. Every department appears to be doing its job.
Then someone asks a different kind of question: Why are customers leaving? Why are employees exhausted? Why does routine work require executive escalation? It seems we are working harder without becoming much better?
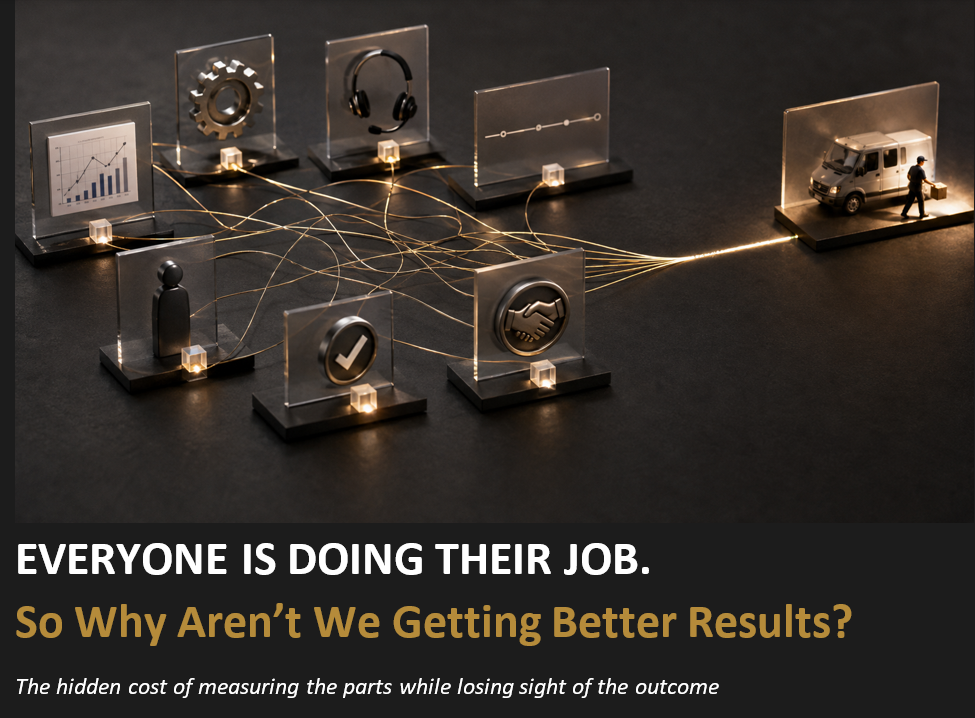
The room becomes quiet, It’s not because the numbers are necessarily wrong, but because each number describes only one part of a larger reality.

The Customer Does Not Experience Your Departments
Consider a commercial customer whose truck or piece of equipment stops operating. Service schedules an inspection. A technician diagnoses the problem. Parts discovers that a component is unavailable. The supplier provides an uncertain date. Warranty requests additional documentation. The salesperson tries to preserve the relationship but has little influence over the repair.
Everyone may be following the approved process. The customer is still losing money.
Inside the organization, the work is divided among functions. From the customer’s perspective, there is only one question: When can I operate again?
The same pattern appears in healthcare, government, construction, technology, manufacturing, and professional services. A patient moves through several departments, each completing its responsibility, while the complete journey remains confusing. A project delivers the specified system, but adoption is weak and the promised benefit never appears. A call center reduces handling time, but customers call back because their problems were not resolved.
Organizations divide work because specialization is necessary. But customers, employees, and communities experience the result of how those specialties work together.

The Mistake: Measuring Motion as Progress
Most organizations are not short of metrics. They track revenue, margin, productivity, utilization, cycle time, customer satisfaction, defects, turnover, schedule, budget, safety, and risk. These measures can all be useful.
The danger begins when they are treated as independent truths.
A metric improves |
While the system worsens |
The missing question |
| Productivity rises | Errors and rework grow | Was the work right the first time? |
| Utilization rises | Waiting time and queues grow | Did we preserve capacity to respond? |
| Inventory falls | Parts shortages and downtime rise | What is the total cost of availability? |
| Cases close faster | Repeat contacts increase | Was the customer’s problem resolved? |
| The project is on time | Adoption and benefits lag | Did delivery create value? |
A central principle of Outcomes by Design™ is that results emerge from relationships. Revenue is related to capacity. Speed is related to quality. Utilization is related to responsiveness. Inventory is related to reliability. Project delivery is related to adoption. These are all part of an ecosystem with interrelated parts that impact each other in ways that metrics do not always capture in a visible way. A leader who sees only one side of the relationship may improve the number while weakening the outcome.
Every Metric Is a Quiet Instruction
Metrics do more than describe performance. They direct attention. Attention shapes decisions. Decisions shape behavior.
Tell a service team that speed matters most, and people will move faster. Tell a sales organization that volume matters most, and people will sell more. Tell a department that budget variance matters most, and managers will protect the budget. These responses are not evidence that people are careless. They are evidence that people take leadership signals seriously.

The useful question is not simply, “What does this metric measure?” It is, “What behavior would a reasonable person adopt if they took this metric seriously?”
That question often explains behavior that leaders have been trying to correct through reminders, training, and escalation. When a behavior is repeated across capable people, the problem may not be motivation. It may be design.
What the Evidence Tells Us
The data reinforce the argument.
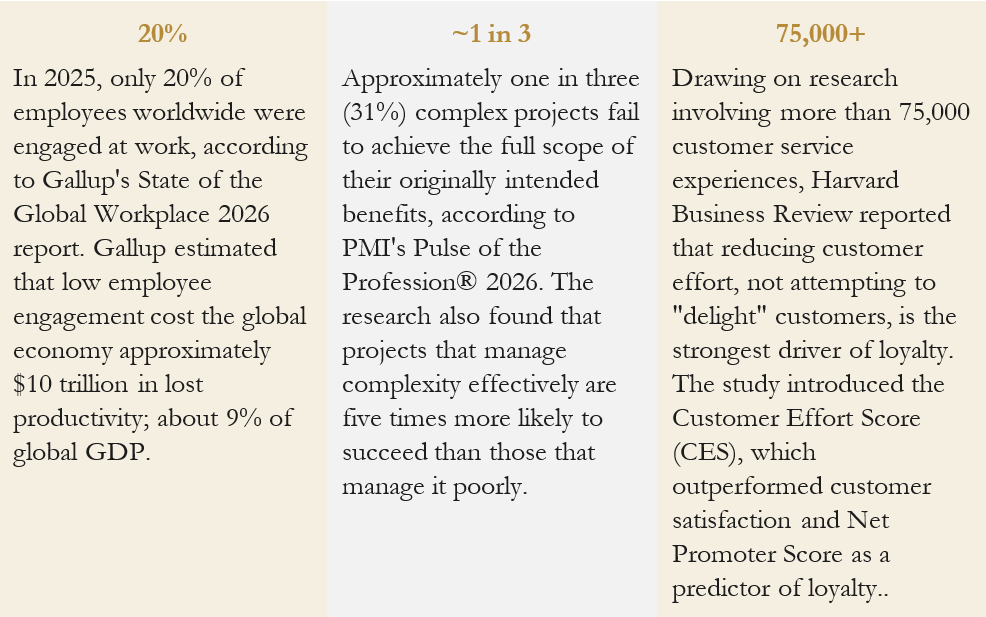
The findings come from different disciplines, but they point in the same direction. People lose connection to meaningful work. Projects complete tasks without realizing benefits. Customers become frustrated by the effort required to navigate organizational complexity. The visible metric may improve while the lived outcome deteriorates.
The American Society for Quality’s 2025 Cost of Quality report makes a related point: poor quality hides in rework, delays, warranty, complaints, returns, and other failures that conventional accounting may scatter across departments. The most expensive work in an organization may be the work that must be done twice—but never appears on one line of the dashboard.
A Better Way to See Performance
Leaders do not necessarily need a larger dashboard. They need a more coherent view of reality.
Begin with five questions:
1. What outcome are we trying to create?
Describe success from the perspective of the customer, employee, stakeholder, or community—not merely the department.
| 1. What outcome are we trying to create? | Describe success from the perspective of the customer, employee, stakeholder, or community—not merely the department. |
| 2. What relationships make that outcome possible? | Identify the people, functions, suppliers, systems, decisions, and handoffs on which the result depends. |
| 3. What are we measuring: activity, output, or outcome? | Calls answered are activity. Cases closed are output. Problems resolved and trust restored are outcomes. |
| 4. What behavior do our measures encourage? | Pair every important measure with a balanced measure: speed with quality, utilization with responsiveness, cost with reliability, delivery with adoption. |
| 5. Who is watching the whole? | When everyone owns a piece, no one may own the outcome. Assign responsibility for seeing the end-to-end result. |
This is where organizational clarity becomes a competitive advantage: clear goals, visible data, an understanding of the system, and the ability to make better decisions. Cohesion leads to clarity. Clarity makes intentional action possible.
Better Results Begin Between the Boxes
Most leaders do not need to demand more effort from people who are already working hard. They need to make the outcome clearer. They need measures that reveal relationships rather than conceal them. They need to pay attention to the places where customers wait, employees struggle, responsibility fragments, and locally sensible decisions combine to create an irrational result.

That is both the problem and the opportunity.
Every meaningful improvement begins when curiosity becomes stronger than certainty. Instead of asking, “Who failed?” leaders can ask, “What made this result likely?” Instead of pushing each department harder, they can improve the relationships among the parts. Instead of celebrating a green dashboard, they can ask whether the system created an outcome worth having.
The purpose of measurement is not to make every number look good. It is to help people see reality well enough to change it intentionally.
Better outcomes rarely begin with a new dashboard. They begin with a better question.

ABOUT THE AUTHOR
Mark Fitzsimmons is Managing Director of 360 Degrees Management Consulting. His work helps leaders create clarity from complexity, strengthen the relationships among the parts of their organizations, and design better outcomes across strategy, operations, projects, leadership, and continuous improvement.