Turning Off Warranty Losses

Turning Off Warranty Losses

Guest writer Christ Kohart is back this week with a continuation of his topic on warranties with his blog post, “Turning Off Warranty Losses.”

In our last discussion, we reviewed the cost (financial loss to our dealership) of replacing a simple hydraulic tube covered by an OEM standard new equipment warranty. We also discussed the importance of sharing our dealership’s value-add with our customers; that example was a small hypothetical of what a dealer’s service operations extend to support our customer base daily.

How do we properly allocate these write-offs without dumping them into a general cost bucket? Here are two ideas:

Simple Method: We can look at our warranty write-offs for the previous fiscal year and allocate a percentage as a line-item cost to each new whole goods sale during the upcoming fiscal year. While the cost recovery trails the expense by one year and is subject to market fluctuations (good vs. bad years), it is a starting point. In this example, let’s assume that our write-off account shows a net negative balance of $200,000 at the close of our current fiscal year. To fairly allocate this loss to our upcoming fiscal year, we can’t divide our forecast unit sales count by the $200K loss as it will unfairly allocate to lower-cost machines. For this example, we use our forecasted OEM whole goods cost (exclusive of rebates, allowances, freight, etc.) of $10,000,000. If we do some quick and simple math, adding 2% to the cost of each new machine we bring in during the year should net us out with a close to $0 warranty loss. This 2% becomes a line in your build spreadsheet, just like inbound freight, receiving, PDI, standard prep, etc. Beware: the downside to this simple method is that one specific large warranty hit during the year can skew the numbers and hurt your competitive position – you’ll have to carefully gut-check your results.

More Accurate Method:  Consider allocating the warranty costs by OEM, model type, and, potentially, application. Depending on your dealership’s software, this can be relatively easy or complicated. Due to the limitations of the software platform deployed in my old dealership, this was an arduous exercise but well worth it once we began extracting meaningful data. While this will take some time to assemble, once the data model has been created, you should be able to run a routine to update your numbers regularly.

I’m going to limit the sample for our example, but this formula works for almost any size dealership:

  1. Three-year lookback
  2. Two OEMs represented.
  3. Three different model classes (types) spread between the two OEMs.
    1. Class 1 = 15-30 MT hydraulic excavator
    2. Class 4 = 80-150 HP tractor dozer
    3. Class 10 = Medium skid steer loader

High-level steps to make the data meaningful:

Run a detailed report and export it to any solution that can manipulate data, by OEM, of all whole goods sold by model class. You need this information to establish the quantity of each model class.

Run a detailed warranty report and export it using the same criteria. Ensure the report includes all costs and all recovery; this should include any additional policy or extraordinary cost reimbursements received from your OEMs.

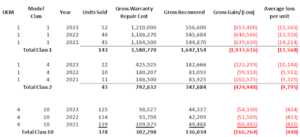
Let’s review some of the information in this spreadsheet. We can quickly see what our average warranty loss per machine costs our dealership to support – we’ll discuss the lost profit potential on all those labor hours given away at cost in an upcoming blog. We can also see trends if the average loss varies yearly; in our example, they stayed close. 

We now have data that is accurate by OEM and model class, we’ll discuss adding application as a factor in a future blog. It makes sense that a small skid steer will cost us much less in terms of warranty support than an excavator. This report would also highlight an outlier you would want to adjust manually; using the “simple method,” this would not stand out.

Run this model for your dealership – hopefully, the results are not a surprise when you review them, although they usually are. If you think the numbers are overstated, start with a percentage – even at 50% of the numbers presented above, our sample dealership will add approximately $421,000 to the bottom line in the upcoming fiscal year if you use a three-year average as your basis. While the numbers used have been kept low for this example, I hope they shed some light on the power of accurately tracking these costs. 

Set up at least one revenue GL account (preferably by OEM and model class) to begin recording the offset to your warranty loss account(s).

This is an example of setting up your company to stop writing off warranty losses. If your business system cannot provide this information, many excellent third-party products integrate with most of our industry’s business systems and will ease your journey. The cost of your investment in the project, and perhaps the third-party product, will be returned quickly.

Did you enjoy this blog? Read more great blog posts here.
For our course lists, please click here.