Utilization of Business Tools: Understanding and Growing the Dealer’s Hydraulic Business
Utilization of Business Tools: Understanding and Growing the Dealer’s Hydraulic Business

Guest writer Ron Wilson continues his study of the hydraulics side of our industry in this week’s guest blog, “Utilization of Business Tools: Understanding and Growing the Dealer’s Hydraulic Business.”
Customer and industry surveys can play a significant role in identifying and developing growth opportunities in the product support business. The following is an example of how survey information can help shape the hydraulic rebuild/repair business within a dealership.
Three examples of survey information:
- Industry studies & research
- Study the local market to evaluate the current state by using customer input.
- Dive into the historical parts & service sales activities to support finding and identify new opportunities.
Industry Studies and Research
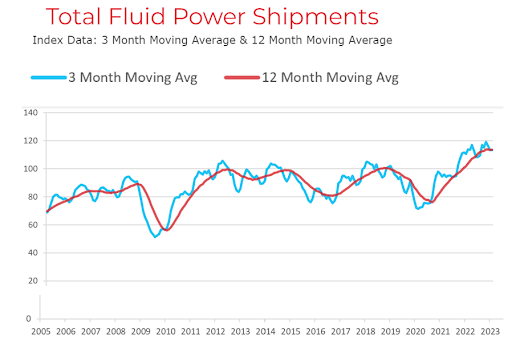
There are many professional trade associations that conduct ongoing studies. An example relating to the hydraulic industry is the information from National Fluid Power Association (NFPA) https://nfpahub.com/stats/market-trends/. This organization provides some free information from their website, and a deeper dive can be obtained through membership status. For example, the information below provides the dollar volume trend in fluid power shipments over the past several years. A deeper dive into more specific hydraulic markets is available from the website such as mobile hydraulic components.
Studying the Local Market
Comparing the local market to the national market brings a clearer view of the opportunities and areas to focus on to obtain a deeper understanding of the potential.
Designing the Survey of the Local Market is an important starting point.
The initial questions of why we are doing the study and what is the intent of the outcome.
- Objective- Define the objective of the survey:
- Are we gathering feedback on existing programs/services?
- Identifying new offerings opportunities
- Identifying areas for improving current programs/services
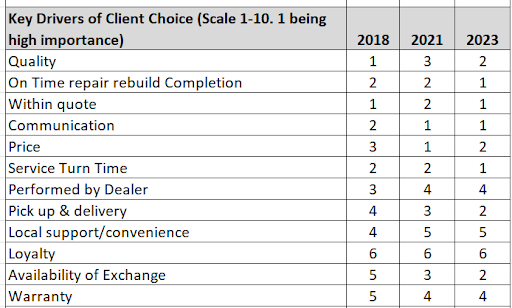
Below is an example of the customer responses from three surveys conducted between 2018-2023. This allows us to determine changes in the market and customer expectations:
- Ranking 1 & 2 shows the area of high importance to the customer, while 5 & 6 shows the less important. The scale was in a range of 1-10 (1 being of most importance).
- Changes in the market can be seen in Pick Up & Delivery and Availability of Exchange. Both areas have become of higher importance over the three surveys, while Warranty, Loyalty, Local Support/Convenience, and Performed by Dealer being of less importance.
- Without the survey we may have selected focus areas that can be costly and not as important to the customer and overlook areas that are of importance to the customer.
- Develop the structure of the questions.
Are we trying to identify the:
- Satisfaction with current services
- Areas needing improvement.
- Additional services to be added to current offerings.
- Overall experience and suggestions with our company and with competitors
The information below provides examples comparing rebuild quality and pricing of the common hydraulic components. A key element shown below is the customers feel the rebuild quality is about the same as the competitors, but the pricing is considerably higher.
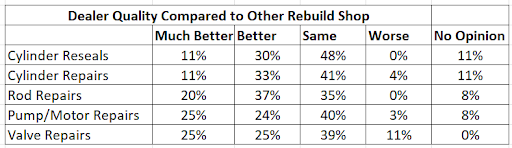
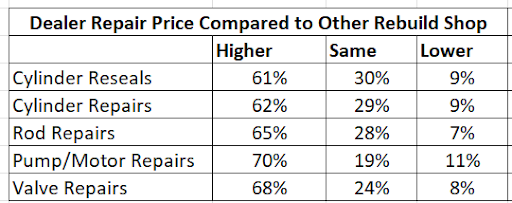
The above information can lead to discussions and modifications to address these two critical areas of quality of rebuilds and pricing.
Utilizing multiple channels to obtain survey responses can provide a broader reach of responses.
A combination of the following can provide a broader view, but requires a little more management of the information going out to the customer and coming back in:
- Email (SurveyMonkey is a great tool with some limitations based on subscription level)
- Website/social media
- One on One visits and interviews (focus groups can be useful in this space as well)
- Internal data showing data points from an historical view.
Analyzing and leveraging the results of the survey is really the important part of effort. We are looking to:
- Identify trends.
- Segment results
- Prioritize Opportunities and Timelines.
The example below identifies the rebuild seal kits that have been purchased over the counter by customers, which can help identify rebuild opportunities for the dealer’s hydraulic shop. For example, a continued growth in the sales of part number A1000 may provide an opportunity to provide exchange lean cylinder for motor graders, or a rebuild program with a firm rebuild price.
The results of the questions below show the customer’s preferred pricing method. In this case Firm Quote is the preferred pricing method in all examples. If our shop only provides Time & Material pricing and our competitors provide Firm Quote, we will most likely gain business by changing our pricing strategy.
The example below shows the level of interest the customers have in utilizing the dealer’s exchange offerings, and the internal use of dealer exchange by the Service Department.
The question below relating to Warranty Coverage may be a surprise. Usually, we think of longer warranties as a sales tool/incentive, but in some cases longer warranties may not be a key driver in growing the business. In the case below 180 days warranty is the most preferred by a wide margin. Anything below and over 180 days may not provide as much perceived value based on the customer’s input.
Implement Change based on the results of the survey information will take some time and focus:
- Translate survey finding into actionable insights will involve:
- Sharing the survey results with the various internal stakeholders such as:
- Parts Department
- Service Department
- Product Support Sales Representatives
- Leadership team
- Action plans and timelines are critical at this point. It may not be possible to implement everything at once but start with a critical few and roll the other items out within a defined time.
- Sharing the survey results with the various internal stakeholders such as:
- Communicate the survey results to the customers sharing the changes/improvements being implemented based on their feedback.
Hopefully the above example shows how the use of external information, local market analysis, customer surveys, along internal historical data can provide direction, focus, and information to grow and manage your product support business.
Disclaimer- The data shown are not actual results, but modified results of an actual study.